In the Vocera Alarm Analytics screen, you can view a dashboard that displays statistics on the most recent alarms generated in the unit that you specified when you logged in.
To display the dashboard, click
![]() .
If this icon has an orange background, the dashboard is already displayed.
.
If this icon has an orange background, the dashboard is already displayed.
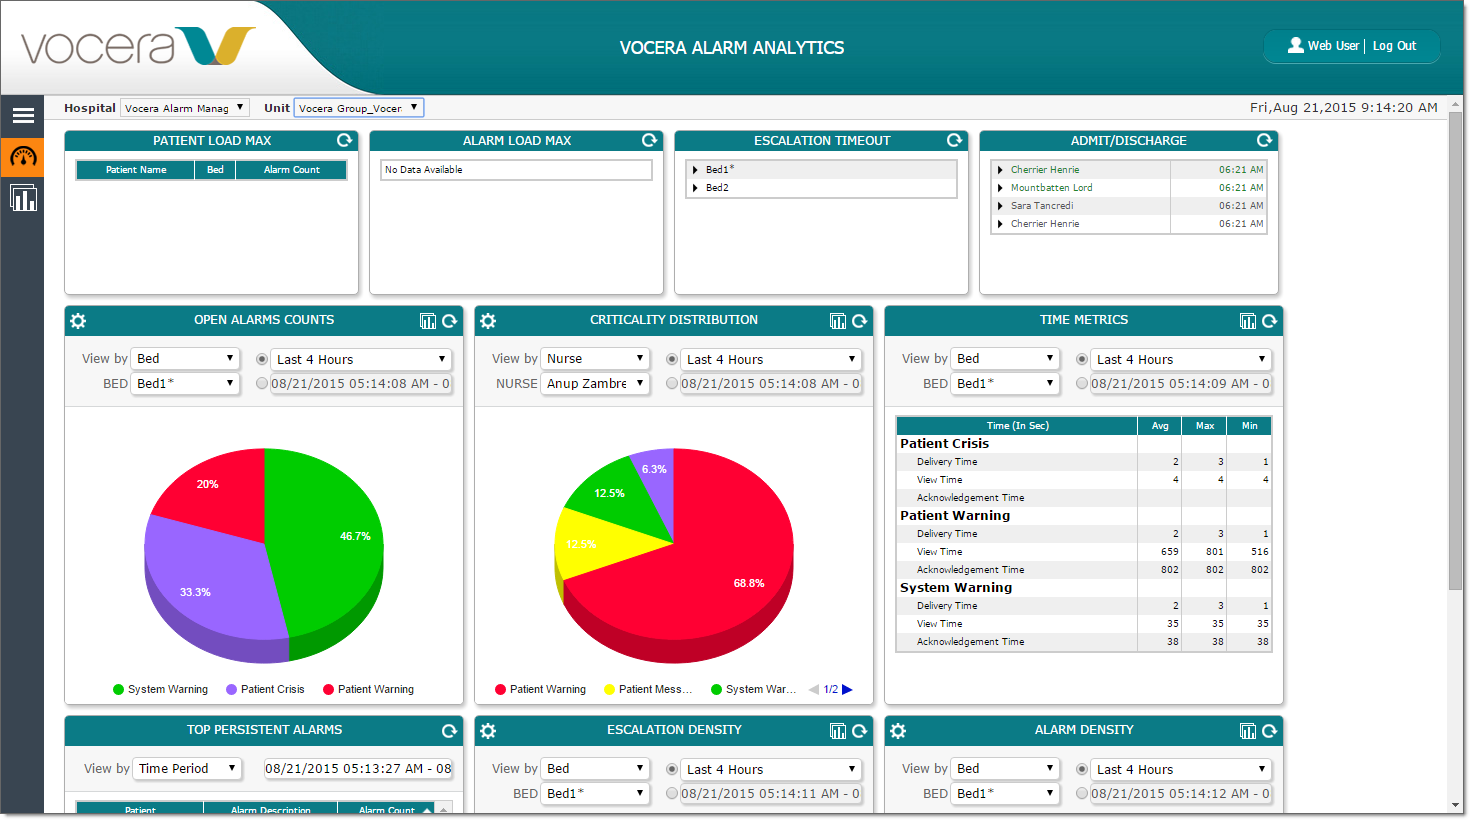
Use the Hospital and Unit dropdown lists to change the hospital and unit that the dashboard displays.
From the dashboard, you can view the following alarm information:
- The maximum patient load
- The maximum alarm load
- Escalation timeout data
- Admit/discharge alarms
- Open alarms counts
- Alarm criticality distribution
- Time metrics
- Top persistent alarms
- Escalation density
- Alarm density
Each of these metrics is displayed in a separate pane on the dashboard.