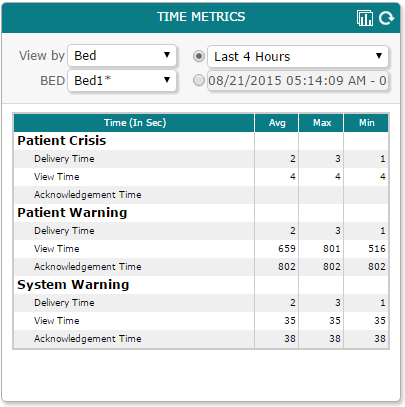
The Time Metrics pane of the
the Vocera Alarm Analytics dashboard displays
time metrics for any bed or nurse, or displays time metrics for
all alarms.
-
From the View by dropdown list, select Bed
to display time metrics for a bed, select Nurse to display
time metrics for beds assigned to a nurse, or select All to display
time metrics for all alarms.
-
If you have selected Bed, from the Bed
dropdown list, select the bed for which you want to display time metrics.
-
If you have selected Nurse, from the Nurse
dropdown list, select the nurse for which you want to display time metrics.
-
Select one of the following:
-
The time period for which to display time metrics, such as Last 1 Hours.
-
A date range for which to display time metrics.
The following time metrics data is displayed:
- The average response time, in seconds.
- The maximum response time.
- The minimum response time.
-
Click
 to display a comparison of criticality distributions in the Comparison pane. See Viewing Comparisons for more details
on displaying comparisons.
to display a comparison of criticality distributions in the Comparison pane. See Viewing Comparisons for more details
on displaying comparisons.
-
To update this information,
click
 .
.