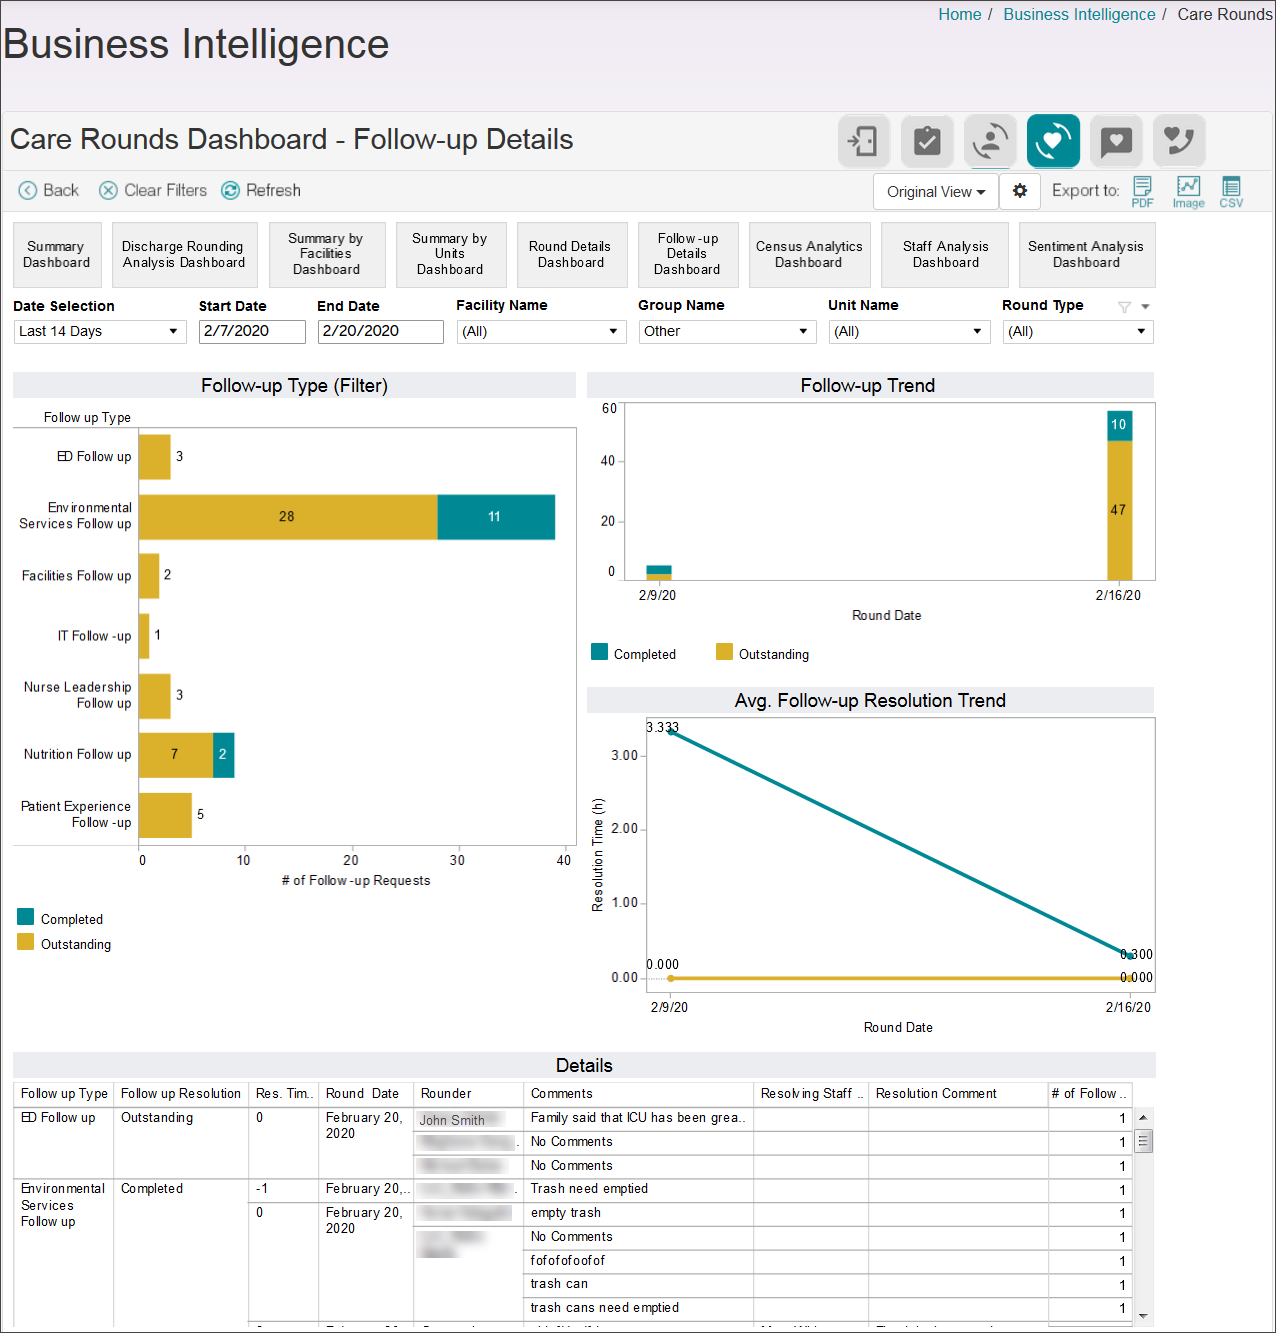
The Follow-up Details Dashboard displays more specific trending data about follow-ups requested within the facility. The displayed data includes the follow-up types, follow-up trends, average follow-up resolution trending, and the details from submitted follow-ups.
The Follow-up Type graph shows a frequency of follow-up requests for a given follow-up type. The Follow-up Trend graph displays the frequency of follow-ups for a given date. The bar’s color associated with the follow-up details more specific information, and in this example the teal color indicates a completed follow-up, while gold indicates an outstanding follow-up. The teal and gold colors represent the percentage distribution of completed to outstanding follow-up data provided to VCE on a given date.
The Average Follow-up Resolution Trend graph shows the resolution time measured in hours, for a given day. The line color indicates the trend of completed (teal) and outstanding (gold) follow-up requests.
Details are displayed in a table on this dashboard, with specific information on the follow-up request comments and resolution comments. Full details include the follow-up type, resolution status, resolution time, name of the rounder who submitted the follow-up request, name of the resolving staff, number of follow-up requests made per follow-up type. Use the scroll bar in this table to display the full list of follow-up types reported on in this dashboard view.