Business Intelligence (BI) provides access to the rounding data stored in VCE databases. Data is organized into dashboard views that can be customized to reveal trending, as well as detail, information.
The software and analytics work in concert to capture the voice of the patient and make it readily available to care team members along the patient’s journey.
Dashboards allow you to view data in near real-time, and filter the data to identify views specific to your needs:
- Identify gaps and improve outcomes in managing the experience and quality of care per patient, by department, enterprise-wide, and across the care continuum through multi-dimensional analytics.
- Receive real-time data analysis, trends, and dashboards for managing patient experience and quality of care.
- Drill down to patient-level details to analyze and better understand the root causes of readmissions, patient dissatisfaction, and lost revenue.
- Analyze patient’s experience throughout a service period, from prior stays, and across different facilities within a system.
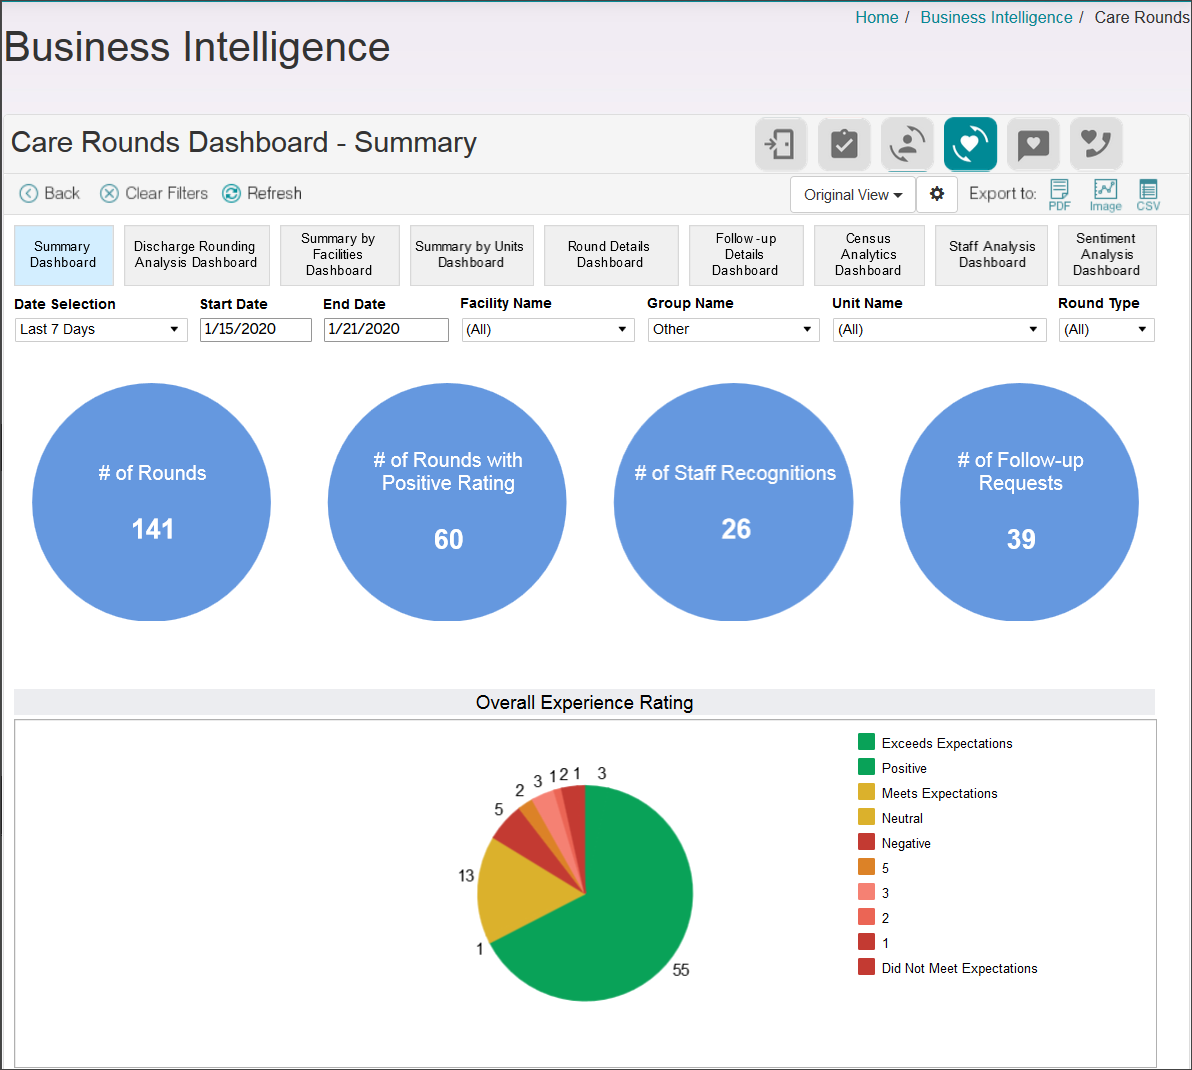
Data views are also exportable to PDF, image, and CSV formats.
Note: The BI dashboards that display will depend on the modules you have been granted
permission to work with.
The following displays an example of a BI dashboard in VCE.