[Data Source: VMI] Summarizes event data and average reply time from VMI integrations sources only. Data displayed includes the events and priorities that are being sent and responded to for specific units. Use this dashboard to understand replies and actions taken by users.
The information displayed on the screen is determined based on the filters that you apply. The available filters are:
| Filter Name | Filter Description |
|---|---|
| Date Range | The date range to include in the results. By default, the value is the current date; however, you can select from a list of options. For example, you can select the option "Last 7 days" or "Last 30 days." |
| Facilities | Used to filter data based on user facilities (common facility name) specified while mapping Vocera Voice Server User Site and Engage Facility. |
| Units | Used to filter data based on user
units (common unit name). Common unit names are referenced from a
crosswalk table cwunit that are mapped from Vocera Voice Server User Department and Engage Units. Note:
The displayed units drop-down filter may be constrained due to the Facilities filter. Unknown Unit or Department display data for all users that are not part of any department selected within the Facilities filter. |
| Priorities | Used to filter interruptions data based on its priority. Displays high, urgent, normal priority for VMP messages, VMI, and Vocera Voice Server. It also displays alarms and alert priorities from Engage. |
| Clients | Used to filter VMI alert data based on the client ID. Lists the client Id specified while sending an alert using VMI API. |
- Event Reply
- Event Summary
- Reply Trend
- Unit Reply Time
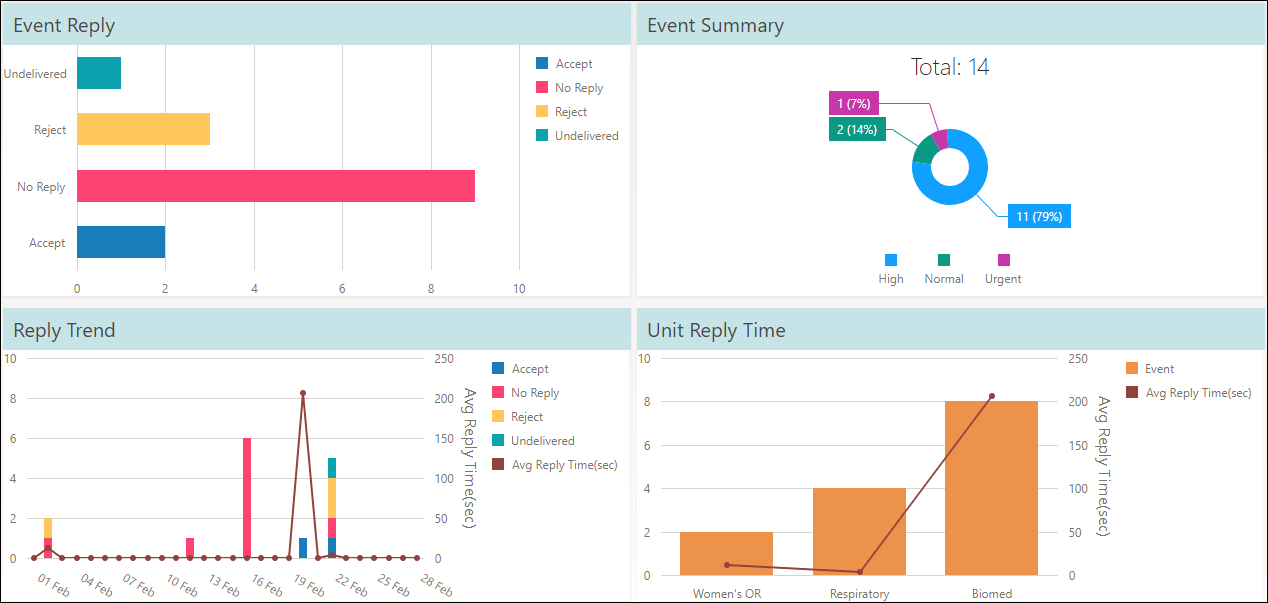
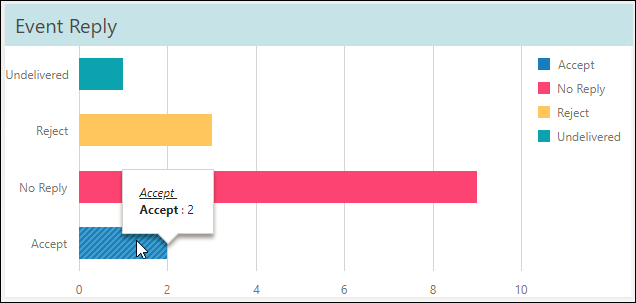
Event Reply
This widget displays the action taken by users for replying to an event. The actions are categorized as accept, reject, undelivered, and no reply. Mouse over an event reply type to display the count. Click on a legend to toggle the view.
Event Summary
Every event is classified based on its priority. The event priorities are Urgent, High, and Normal. This widget displays the event priorities and its percentage for the total number of events that occurred during the selected date range.
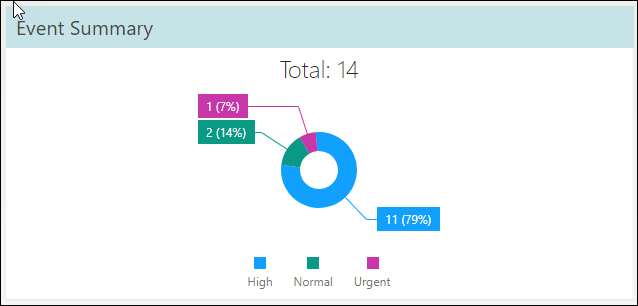
For example, in this scenario,
- Total Events count = 527
- Urgent Priority count = 233
Percentage of Urgent Priority= (233/527) x 100 = 44%
- High Priority count = 251
-
Percentage of High count = (251/527) x 100 = 48%
- Normal Priority count = 43
-
Percentage of Normal count = (43/527) x 100 = 8%
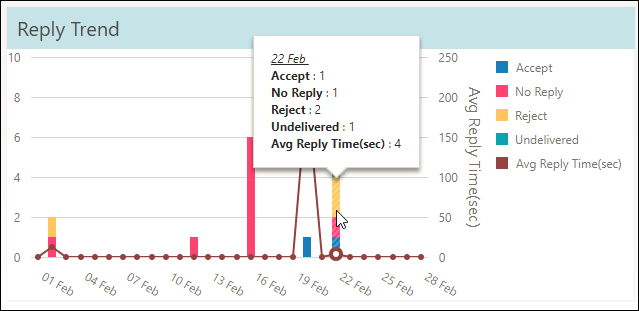
Reply Trend
The Reply Trend widget displays the number of alerts received over time along with the average reply time (in seconds) for the period specified. Mouse over a trended value to display the data for each reply type and the average reply time during the selected date range. Click on a legend to toggle the view.
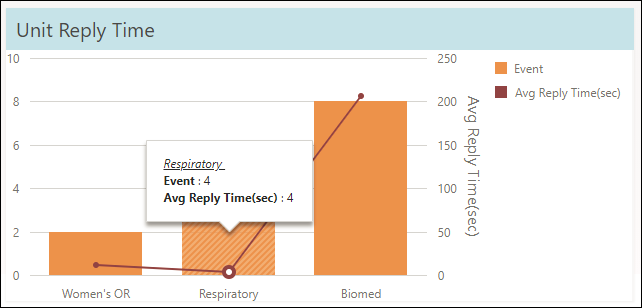
Unit Reply Time
This widget displays the reply time taken by each unit. This information is used to identify and categorize the units based on their reply time. Mouse over a trended value to display the event count and the average reply time (in seconds) for the corresponding unit during the selected date range. Click on a legend to toggle the view.
Considerations
In Event Reply widget, only the following responses are configured by default in the Analytics system as Accept:
- ok
- yes
- acknowledge
- accept
- call started
- call ended
- call back
- acceptedNote: However, you can configure a new response for Accept in the dimvmiresponse table.