[Data Source: Voice Server] Displays summary of completed and missed calls across all departments. It includes details such as missed call reason, busy, not online, not logged in and so on. Use this report to understand the trend of completed and missed calls and calls count by missed reason.
The information displayed on the screen is determined based on the filters you apply. The available filters are:
| Filter Name | Filter Description |
|---|---|
| Date Range | The date range to include in the results. By default, the value is the current date; however, you can select from a list of options. For example, you can select the option "Last 7 days" or "Last 30 days." |
| Facilities | Used to filter data based on user facilities (common facility name) specified while mapping Vocera Voice Server User Site and Engage Facility. For Alarms and Alerts data: Used to filter data based on Event’s facilities (common facility name) specified while mapping Vocera Voice Server Site and Engage Facility. |
| Departments | Used to filter data based on user departments (common unit name). Common unit names are referenced from a crosswalk table cwunit that are mapped from Vocera Voice Server User Department and Engage Units. For Alarms and Alerts data: Used to filter data based on Event’s departments (common unit name). Common unit names are referenced from a crosswalk table cwunit that are mapped from Vocera Voice Server Department and Engage Units. Note:
The displayed departments drop-down filter may be constrained due to the Facilities filter. Unknown Department display data for all users that are not part of any department selected within the Facilities filter. |
| Call Types | Used to filter call data based on recipient type. The available options are:
|
You can plot the completed and missed call report trend over daily, weekly, or monthly periods. Reports generated for multiple facilities and departments and provide data for each facility, department as well as aggregated total.
- A line chart that displays completed and missed call volume trends over time
- A pie chart that displays slices for each category of call volume results
- A table that displays detailed call volume data
Following is a sample Completed and Missed Calls report:
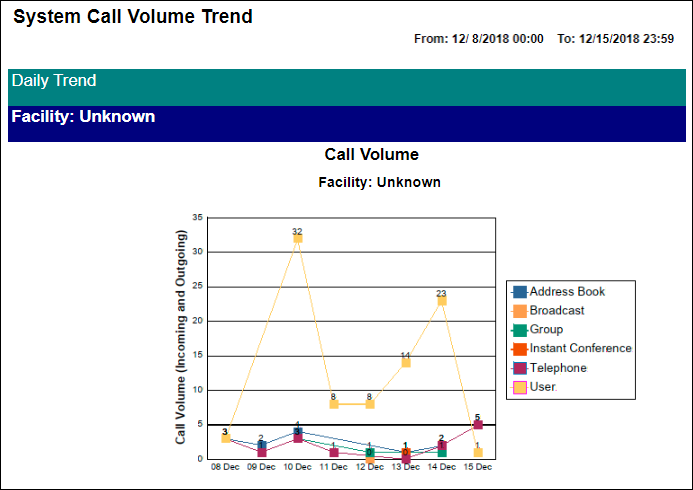
Line Chart
The line chart shows call volume trends over time.
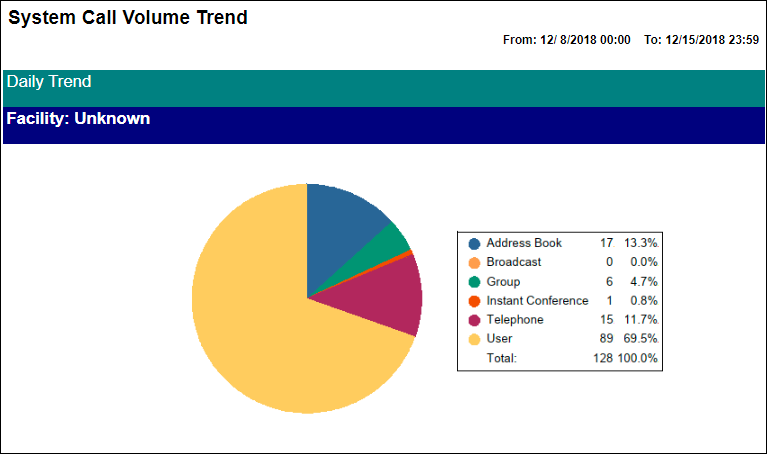
Pie Chart
The pie chart displays slices for each category of call volume results.
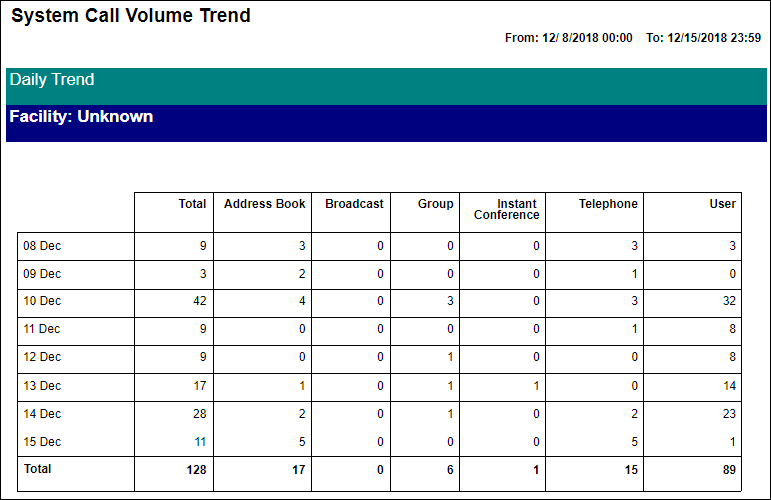
Table
The table displays detailed call volume data.