This topic describes the circumstances when an email notification is triggered. It also describes the steps to configure email templates.
Email Notification Overview
A notification email is an alert message that the Vocera Analytics server sends to notify you when one of the following events occur. The following table shows the notification email types, its email content, and the email template to be used for the applicable Vocera Analytics services.
| Notification Email Type | Email Content | Email Template To Use |
|---|---|---|
| Any service started | INFO: Analytics Service '[[ServiceName]]' successfully started on
Analytics Server '[[ServerName]]'. For example, Analytics Service 'Flume (VS)' is successfully started on Analytics Server 'remote agent-1'. |
service-start |
| Any service stopped | ALERT: Analytics Service '[[ServiceName]]' stopped on the
Analytics Server '[[ServerName]]'. Corrective Action: If it is not stopped intentionally, please restart the service. If this happened multiple times, please contact Vocera Support with service log information. |
service-stop |
| Disk usage threshold reached | INFO: Disk usage threshold reached for drive: '[[DiskName]]' on
Analytics Server '[[ServerName]]'. Note: Remote flume agent drives
will also be monitored.
|
disk-usage-threshold-reached |
| Spark pipeline job failure |
ALERT: Number of pipeline jobs failed: [[FAILED_JOBS_COUNT]] If this issue occurs multiple times, please contact Vocera Support. Note: The Spark pipeline job failure notification email is supported
from Vocera Analytics 1.1.0 release onwards.
For information on configuring failed job notification for Spark pipeline, refer to Configuring Spark Pipeline Job Failure Notifications. |
jobs-failure |
| Test email | Test email from Vocera Analytics to test email settings. | config-test |
| Database downtime threshold reached |
ALERT: Database service is down for the past [[DB_STOP_DURATION]] minutes. All the services are being stopped. Contact Vocera Support immediately. When the database service is down and the configured database downtime threshold (default is 15 minutes) is reached, then Spark and Flume services will also be stopped. |
db-down-threshold-reach |
| Invalid pipeline state | The Spark service stopped unexpectedly and has stopped processing
data for [[SPARK_DOWNTIME_THRESHOLD]] minutes. The service will be
started automatically. Note: You are not required to take any
action.
Contact Vocera Support if this issue occurs multiple times. When Spark service is down and the configured threshold time (default is 15 minutes) is reached while any Flume service is running. To restore the pipeline, Spark service is started after sending this email. |
invalid-pipeline-state |
| Invalid pipeline state shutdown |
The Spark service has consecutively stopped working unexpectedly. The system tried recovering Spark service [[RESTART_COUNT]] times within the last [[FAILURE_DURATION]] minutes and was unsuccessful. Therefore, the system is shutting down the pipeline (Spark and Flume services). Contact Vocera Support if this issue occurs multiple times. When restarting Spark service for a configured number of times (default is 3), and still results in Spark shutting down in a span of configured time (default is 60 minutes), then this email is sent and subsequently the pipeline is shutdown. |
invalid-pipeline-state-shutdown |
| Failed rule |
[[TABLE_NAME]]: no data after [[CONSECUTIVE_FAILURES]] failed attempt. Data last updated at: [[COLUMN_LAST_UPDATED]] Lists failed pipeline rules. |
failed_rule |
| Monitoring rule failure |
ALERT: Following rules failed [[FAILED_RULES]] When pipeline monitoring rules fail, this email is sent. |
monitoring-rule-failure |
| Monitoring rule failure limit reached |
ALERT: Spark and Flume services are being stopped as limit has reached for following rule failures: [[FAILED_RULES]] Contact Vocera Support immediately. When rule action is set to Notify_And_Stop and data has not been flowing in pipeline for configured time limit (default is 120 minutes), then pipeline would be stopped after this email is sent. |
monitoring-rule-failure-limit-reached |
|
Monitoring rule failure autorecovery |
ALERT: Analytics has not received data for the past [[RESTART_DURATION]]. Spark and Flume services will be restarted to take preemptive measures to reestablish the data connection pipeline. Please login to the Visualization Server and verify if your current data is showing up. Following are the rule failures: [[FAILED_RULES]] Contact Vocera Support if data gaps are more than [[RESTART_DURATION]]. Note: When the rule action is set to
Notify_And_Restart and no new data
was processed for past configured time (default is 120 minutes),
then Pipeline would be restarted after sending this
email.
|
monitoring-rule-failure-auto-recovery |
|
Monitoring rule failure recovery failed |
ALERT: Analytics has not received data for the past [[FINAL_STOP_DURATION]]. Spark and Flume services are being stopped. Following are the rule failures: [[FAILED_RULES]] Contact Vocera Support immediately to avoid data loss! Note: When rule action is set to
Notify_And_Restart and configured
number of pipeline recovery attempts (default is 3) is
unsuccessful, then the pipeline would be stopped after sending
this email.
|
monitoring-rule-failure-recovery-failed |
Configuring Notification Email
You can configure the notification email as per your requirement. The templates for the notification email are located at: <VA_Install_Drive>\VoceraAnalytics\servicemonitor\conf\emailTemplates.
The following screenshot shows the default email template for service-start:
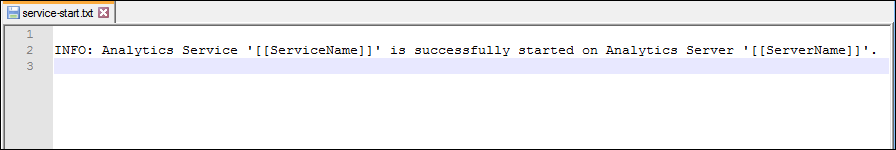
You can modify the email template except the values within the double square brackets: [[ ]]. The value displayed inside the double square brackets are automatically replaced as applicable by the service name, server name, disk name, failed jobs count directly by the Vocera system when the notification email is sent.