Access the reported system event logs in the Vocera Platform Web Console.
Users with the appropriate login credentials can access the logs generated for
auditable events in the Vocera Platform Web Console. See a System Administrator for assistance if needed.
-
Navigate to Status > Audit Log.
The Audit Log displays.
-
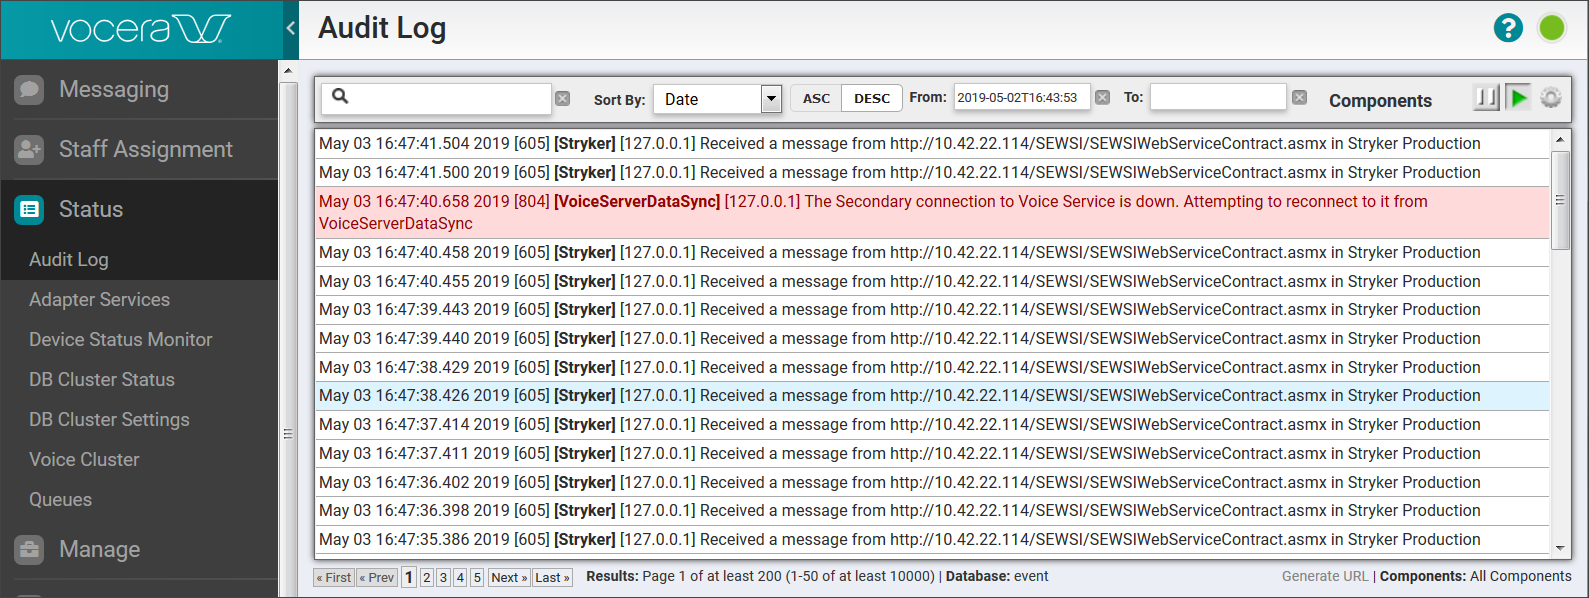
View the scrollable list of audit events in Audit Log. Note that audit events
with a priority level of Error display in red.
-
Use the details provided in the following table to interpret the data provided
for the reported audit events.
| Field |
Description |
| Timestamp |
Date and time of the audit event. |
| Event code |
Event code logged for the audit event. |
| Component |
Name of the component logged for the audit event. |
| Node IP |
Address of the server node for the audit event. |
| Event Statement |
Content of the audit event message. |