[Data Source: Voice Server, VCS] Summarizes outgoing call activity across all units. Details include call types with call durations, command usage details, devices used type, and outgoing call volume trends for the selected date range. Use this dashboard to understand overall Vocera usage (by device or call type) and volume trends as well as the ability to drill into specific units.
The information displayed on the screen is determined based on the filters that you apply. The available filters are:
| Filter Name | Filter Description |
|---|---|
| Date Range | The date range to include in the results. By default, the value is the current date; however, you can select from a list of options. For example, you can select the option "Last 7 days" or "Last 30 days." |
| Facilities | Used to filter data based on user facilities (common facility name) specified while mapping Vocera Voice Server User Site and Engage Facility. |
| Units | Used to filter data based on user
units (common unit name). Common unit names are referenced from a
crosswalk table cwunit that are mapped from Vocera Voice Server User Department and Engage Units. Note:
The displayed units drop-down filter may be constrained due to the Facilities filter. Unknown Unit or Department display data for all users that are not part of any department selected within the Facilities filter. |
| Call Recipient Types | Used to filter call data based on recipient type. The available options are Address Book, Broadcast, Buddy, Group, Telephone, and User. |
| Call Priorities | Used to filter call data
on the priority of the call. List all possible priorities from Vocera Voice Server and Engage. Note: Call priorities can be Normal or Urgent Only. If
filtered on any other call priority, the filter result will not show
any data.
|
The dashboard has the following widgets:
- Unit Summary
- Call Type
- Volume Trend
- Device Usage
- Call Statistics
- Command Usage
Following is a sample Location Call Summary dashboard:
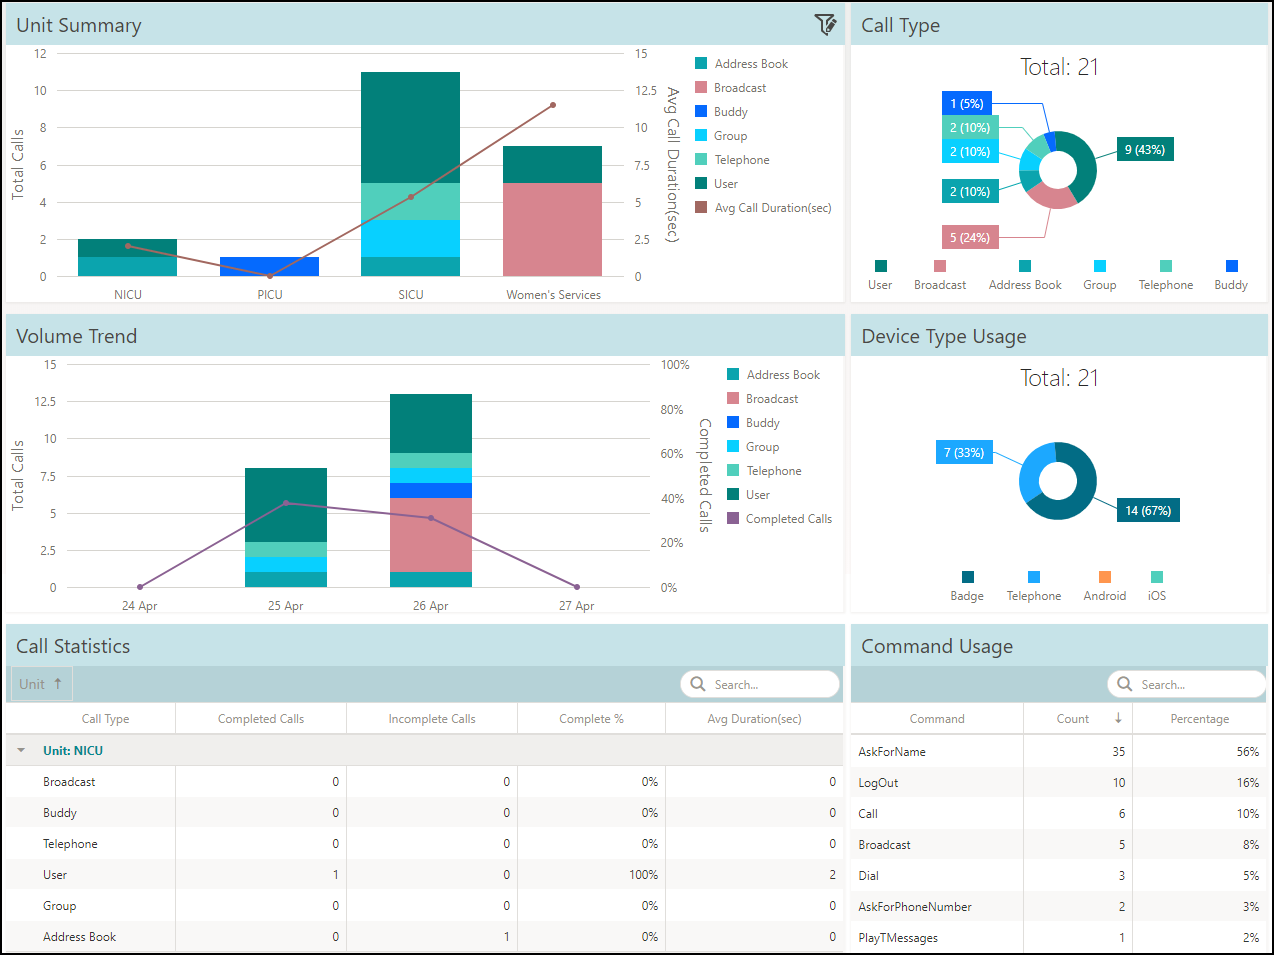
The Location Call Summary dashboard includes contextual filters.
The contextual filters contain a source and a target widget. In this case, Unit Call Summary is the source widget and the remaining widgets are target widgets. Click a unit to display only the corresponding data in the remaining widgets. For example, click NICU to display only the details of NICU unit in all the other widgets.
Unit Summary
The widget summarizes the total calls made in each unit. The parameters considered are total calls made in each unit and average call duration for the selected time frame. Data includes calls made to Address Book, Broadcast, Buddy, Group, Telephone, and User. The widget also displays the trend for average call duration. The Y-axis on the left displays the total number of calls and the Y-axis on the right displays the average call duration. Mouse over a bar chart to display the types of calls made and the average duration of a call for the selected unit.
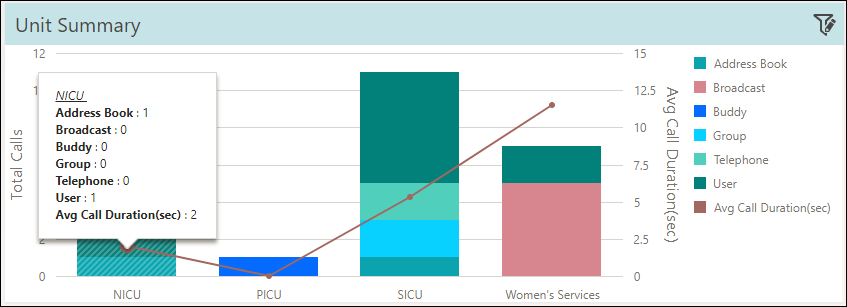
- Address Book—1
- User—1
Total calls made—2
Average Call Duration (seconds)—2
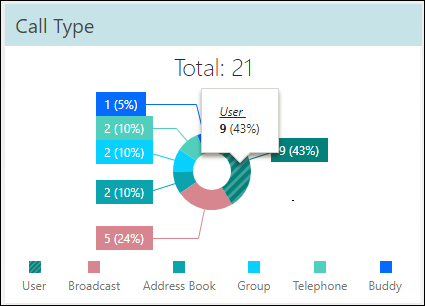
Call Type
The widget displays the different types of calls made at the Vocera Voice Server for the selected time frame. Data includes calls made to Address Book, Broadcast, Buddy, Group, Telephone, and User. Mouse over a slice on the pie chart to display the type of call made and its corresponding percentage.
- Total Calls—21
- User—9
Percentage of User calls: (9/21)x100=43%
- Buddy—1
Percentage of Buddy calls: (1/21)x100=5%
- Telephone—2
Percentage of Telephone calls: (2/21)x100=10%
- Group—2
Percentage of Group calls: (2/21)x100=10%
- Address Book—2
Percentage of Address Book: (2/21)x100=10%
- Broadcast—5
Percentage of Broadcast: (5/21)x100=24%
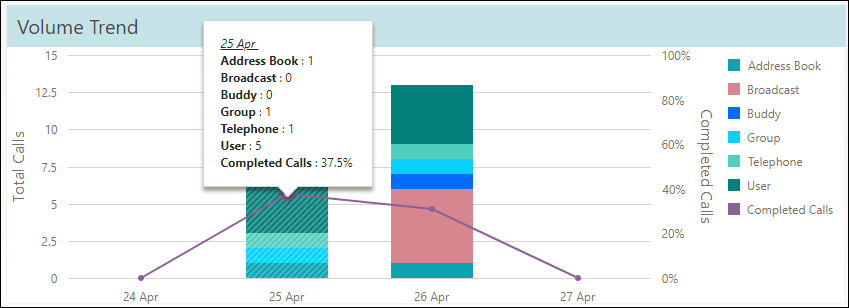
Volume Trend
This widget displays the call volume trend for the selected time frame. The left side of the chart displays the total number of calls and the right side of the chart displays the percentage of completed calls. The widget also displays the trend for completed calls. Mouse over a bar chart to display the types of calls made and the percentage of completed calls for the selected timeline.
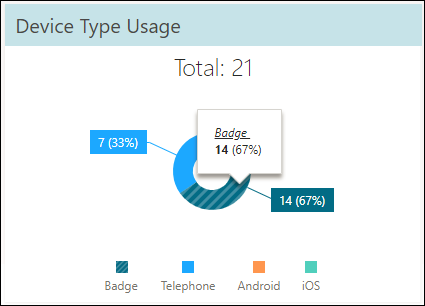
Device Usage
This widget displays the number of times a device was used to make calls. The devices used within the Vocera system are categorized based on Android, iOS, badge, and telephone. Mouse over a slice on the pie chart to display the device type and its corresponding percentage. The widget also displays the total number of calls made.
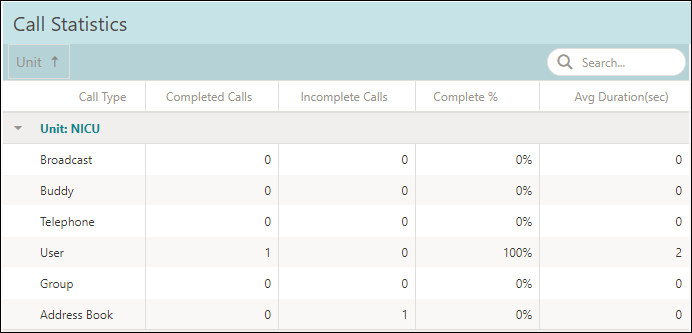
Call Statistics
This table displays the call statistics for the values that are displayed in the above four widgets. Based on the type of calls, it also lists the completed and incomplete calls, the percentage of completed calls and the average duration of the calls for each call type.
Use the Search field to search on a particular unit.
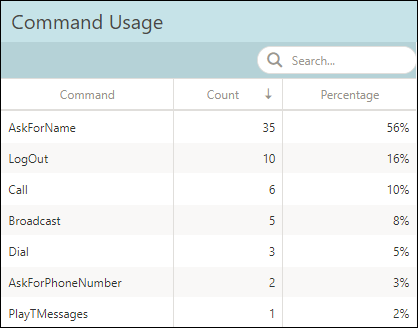
Command Usage
This table displays the list of commands used within a unit. It also displays the number of times and its corresponding percentage for the commands used.
Use the Search field to search on a particular command.