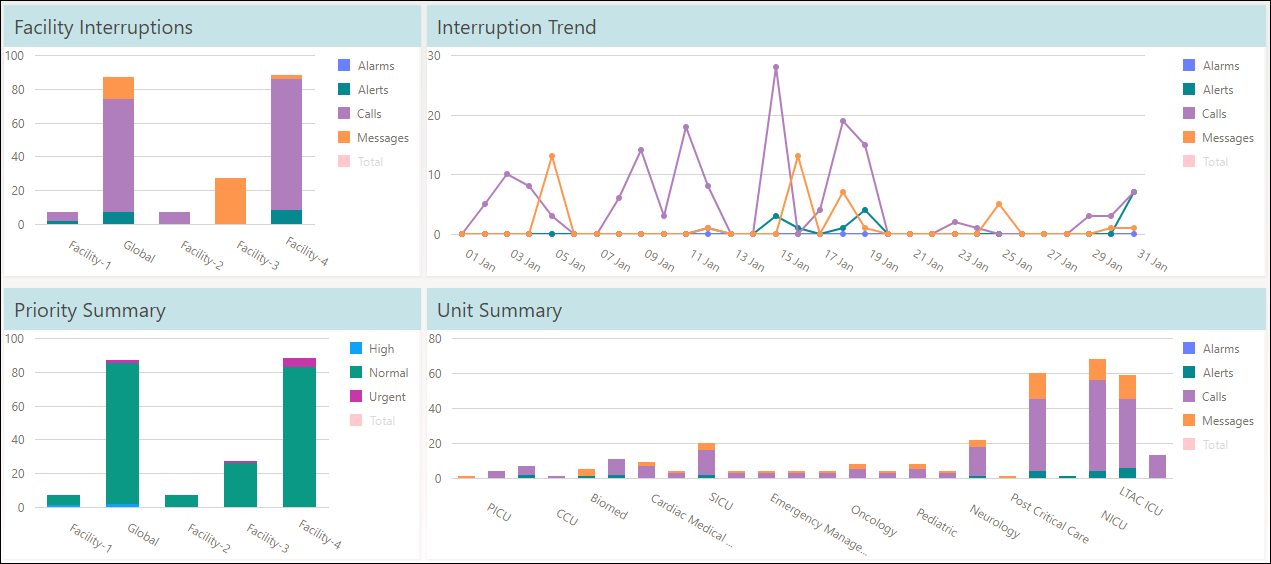
[Data Source: Voice Server, Engage, VCS, VMI] Summarizes interruptions for all types (calls, alerts, alarms and messages) by priority and facility. Data includes summary by facilities, unit, priority and time trends for all interruption sources. This dashboard is used to compare interruptions between facilities and units by priorities and specific interruption types.
The information displayed on the screen is determined based on the filters that you apply. The available filters are:
| Filter Name | Filter Description |
|---|---|
| Date Range | The date range to include in the results. By default, the value is the current date; however, you can select from a list of options. For example, you can select the option "Last 7 days" or "Last 30 days." |
| Facilities | Used to filter data based on user facilities (common facility name) specified while mapping Vocera Voice Server User Site and Engage Facility. |
| Units | Used to filter data based on user
units (common unit name). Common unit names are referenced from a
crosswalk table cwunit that are mapped from Vocera Voice Server User Department and Engage Units. Note:
The displayed units drop-down filter may be constrained due to the Facilities filter. Unknown Unit or Department display data for all users that are not part of any department selected within the Facilities filter. |
| Interruption Types | Used to filter interruptions data based on the interruption type. Displays calls, messages, alarms, and alerts. |
| Priorities | Used to filter interruptions data based on its priority. Displays high, urgent, normal priority for VMP messages, VMI, and Vocera Voice Server. It also displays alarms and alert priorities from Engage. |
The interrupts are classified based on interrupt types such as alarms, alerts, calls, and messages.
- Facility Interruptions
- Interruption Trend
- Priority Summary
- Unit Summary

Facility Interruptions
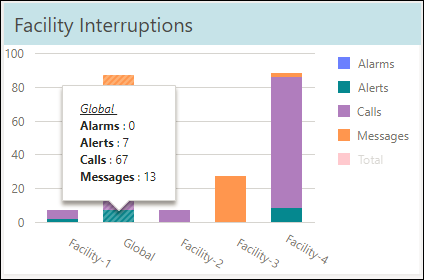
The Facility Interruptions widget displays the number of interruptions that occurred in a facility during the selected period. The information displayed is classified based on all interrupt types such as alarms, alerts, messages, and calls. Mouse over a bar chart to display the count for each interrupt type within a selected facility.
Click a legend to toggle the display. The Total legend is disabled by default. Click the Total legend to enable and view the total interrupt trend across the selected facilities.

Interruption Trend
The widget displays the interruption trend based on the timeline. The widget displays a line graph for each interruption type and total interruptions. The timeline is adaptive based on the date range. For example, if the date range selected is 1 day, the timeline displays data for every hour. If the date range is more than a day and less than a month, the timeline displays data for every day.
Click a legend to toggle the display. The Total legend is disabled by default. Click the Total legend to enable and view the total interruption trend.

Priority Summary
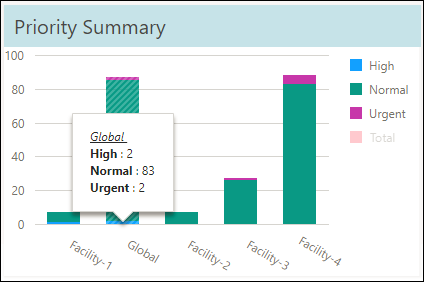
The Priority Summary widget displays the priority of the messages that are received in a facility. The data displayed can be used to compare the interruptions and priorities between facilities at a high level. The total interrupts displayed is a combination of user interrupts distributed by interrupt priority and segregated by facility. The Total legend is disabled by default. Click the Total legend to enable and view the total priority trend.Mouse over a bar graph to view the count of each priority for the specific group.

Unit Summary
The Unit Summary widget summarizes the total interruptions encountered within a specific unit for the selected date range. The data displayed is classified based on all interrupt types such as alarms, alerts, messages, and calls. The bar graph identifies the total interruptions encountered with the respective unit. The Total legend is disabled by default. Click the Total legend to enable and view the total priority trend.

