Vocera Analytics enables you to generate reports from data logs created by the Vocera Voice Server. Creating these reports can improve your implementation of Vocera since you can identify problem areas that can then be addressed.
The key features of the Vocera Analytics reports are:
- Vocera Analytics is installed separately and runs outside the Vocera Voice Server.
- The Vocera Voice Server generates log files to support the Vocera Analytics Server. The Vocera Analytics Server uses this data to generate reports. Some of the reports can help you diagnose end-user and network issues related to the Vocera system. Other reports can help you spot usage trends, keep track of devices, and monitor call volume.
- The report console is a browser-based application that interacts with the Vocera Analytics Server. Use the report console to generate reports and administer the Vocera Analytics Server.
- Generate system performance reports such as average time to deliver an alarm, voice recognition performance, and so on.
- Generate diagnostic reports such as users with voice recognition challenges, units/APs with the most number of connection drops, units/areas with longest alarm delivery time, users with a most number of failed login attempts, and so on.
- Generate offline reports by allowing the user to pick reports and schedule it to be sent by email to their official email address on a daily/weekly/monthly basis.
- Provide the ability for the user to set up custom reports at customer site.
For example, if the unit name NICU is available in Downtown facility and Community facility, then the report displays the unit names as NICU (Downtown) and NICU (Community).
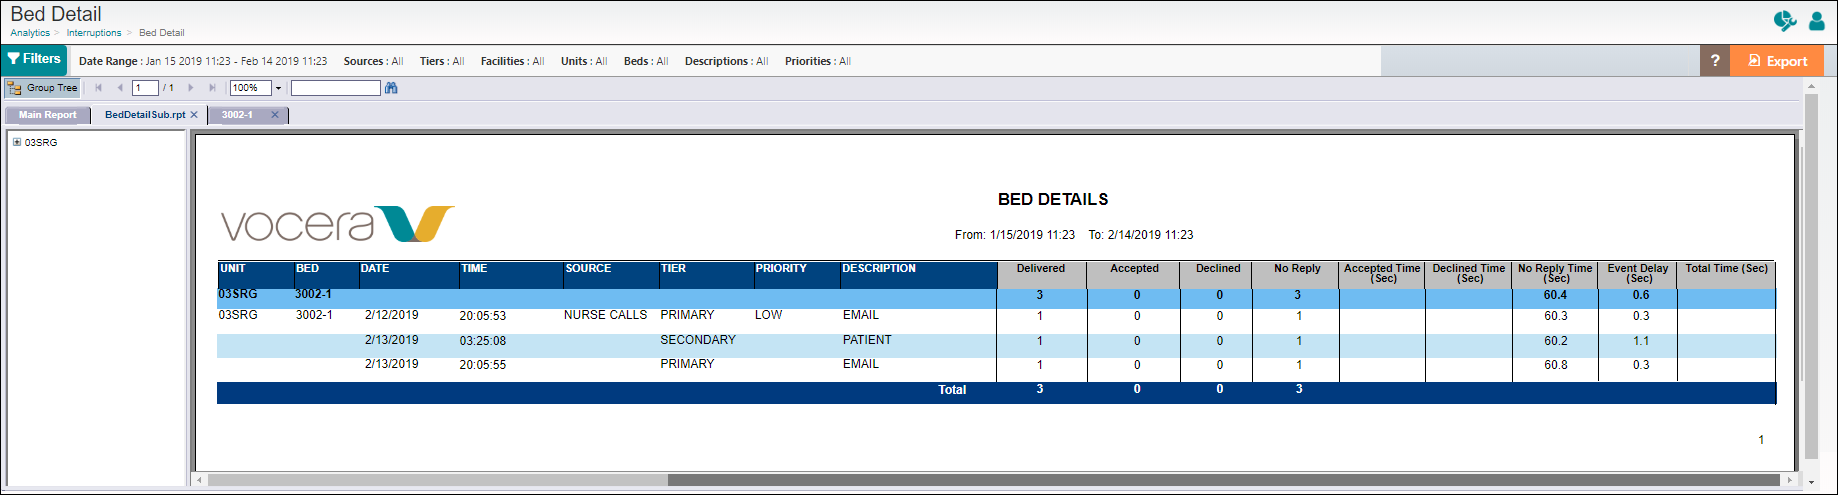
Behavior of Reports in Interruption Folder
Interruption Reports calculate metrics only for escalated events. In certain cases, the count shows zero for average, fastest, and longest elapse escalation time. Also, typical events that are normally configured to not escalate, include device messages and emails.
For information on navigating to sub-reports within Interruption reports, refer to Navigating Sub-Reports in Interruptions Folder.