[Data Source: Voice Server, VMI] Provides a single view containing several summary widgets that specifically measure new Vocera voice metrics. Data included is Voice Index measuring calls per day versus unique users, speech recognition attempts, and a time trend showing calls and logins over time. This dashboard is used to review overall usage of the voice system and measure adoption progress.
The information displayed on the screen is determined based on the filters that you apply. The available filters are:
| Filter Name | Filter Description |
|---|---|
| Date Range | The date range to include in the results. By default, the value is the current date; however, you can select from a list of options. For example, you can select the option "Last 7 days" or "Last 30 days." |
| Facilities | Used to filter data based on user facilities (common facility name) specified while mapping Vocera Voice Server User Site and Engage Facility. |
| Units | Used to filter data based on user
units (common unit name). Common unit names are referenced from a
crosswalk table cwunit that are mapped from Vocera Voice Server User Department and Engage Units. Note:
The displayed units drop-down filter may be constrained due to the Facilities filter. Unknown Unit or Department display data for all users that are not part of any department selected within the Facilities filter. |
This dashboard has the following widgets:
- Voice Index
- Calls per Day
- Logins per Day
- Voice Trend
- Speech Recognition Attempts
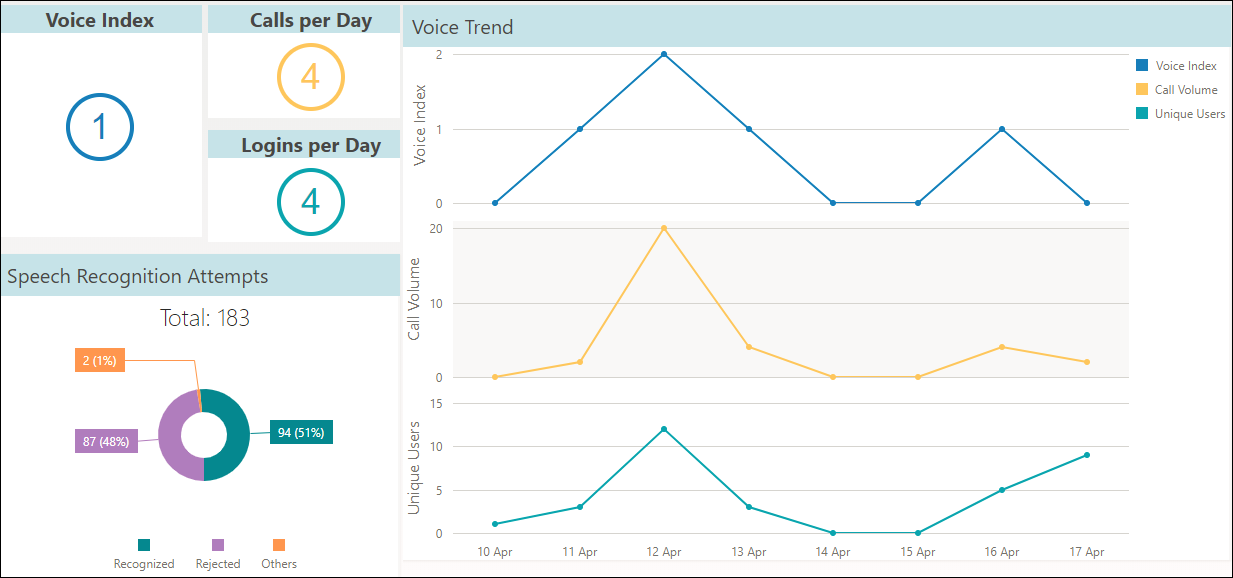
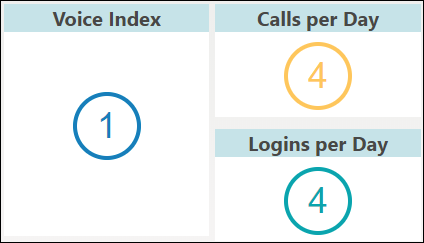
Voice Index, Calls per Day, Logins per Day
- Calls per Day—Specifies the average number of calls/broadcasts per day for the selected
date range.
For example, if date range selected is 8 days and total calls made during the selected date range is 32, then the average calls per day are 32/8=4.
- Logins per Day—Specifies the average number of logins per day for the selected date
range.
For example, if date range selected is 8 days and total logins during the selected date range is 33, then the average logins per day are 33/8=4.
Note: Values are rounded off to the nearest whole number. - Voice Index—Specifies the Voice Index per day for the selected date range.
For example, if date range selected is 8 days, average calls per day are 4, and average logins per day is 4, then Voice Index is calculated by: Average calls per day / Average logins per day, which is 4/4=1.
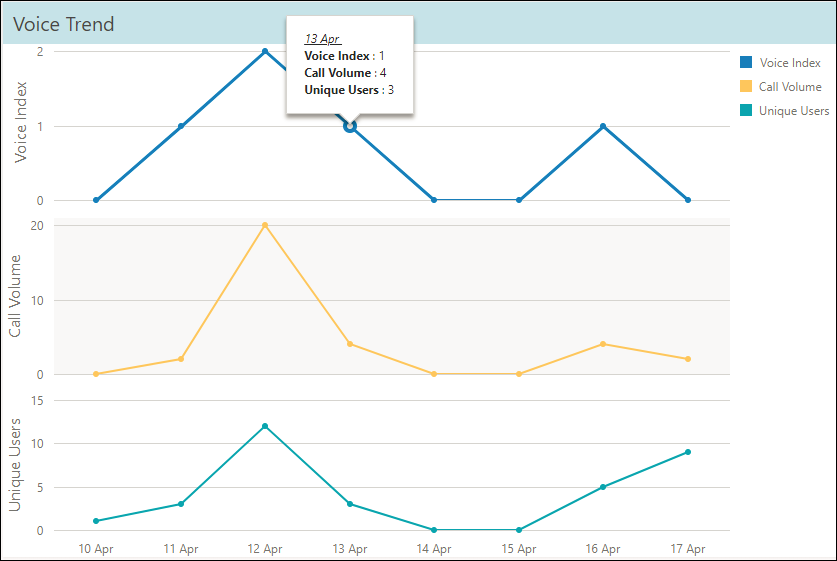
Voice Trend
The Voice Trend widget represents the metrics for Voice Index, Call Volume, and Unique Users in a trended graph for the selected date range. Mouse over a period on the trended graph to display the individual count for all the three metrics for the particular time frame.
Speech Recognition Attempts
The Speech Recognition Attempts widget displays the total number of speech recognition attempts made during the selected date range. The widget is categorized into Recognized, Rejected and Others. The widget shows the count and its corresponding percentage for recognized speech attempts compared to rejected, and other speech attempts in a donut format. The others category considers speech attempts where speech occurred but was not recognized.
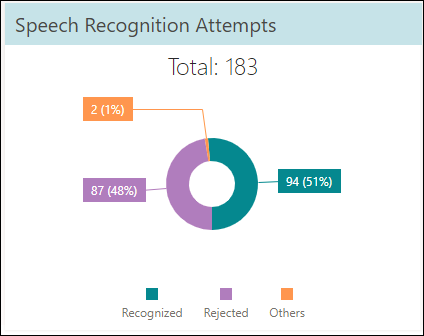
- Total Speech Recognition Attempts is 183
- Speech Recognized is 98. Speech recognized percentage is 98/183 = 51%
- Speech Rejected is 87. Speech rejected percentage is 87/183 = 48%
- Others is 2. Others percentage is 2/183 = 1%