[Data Source: Voice Server, VMI] Compares overall Vocera adoption for two specific date ranges. Data includes user metrics from specific voice call features such as calls to groups, broadcast calls, speech recognition, text messages, conversations, badge usage by version, VCS usage, and maximum user logins. Use this dashboard to compare data across two date ranges to help measure specific facility initiatives.
The information displayed on the screen is determined based on the filters that you apply. The available filters are:
| Filter Name | Filter Description |
|---|---|
| Date Range 1 | Used to filter based on the
date range. By default, the value is the current date. However, you can
select from a list of options. For example, you can select the option
"Last 7 days" or "Last 30 days" or Custom date. This filter data will be considered as the base of comparison for the filtered data from Date Range 2. |
| Date Range 2 | Used to filter based on the
date range. By default, the value is the current date. However, you can
select from a list of options. For example, you can select the option
"Last 7 days" or "Last 30 days" or Custom date. This filter data will be considered as the base of comparison for the filtered data from Date Range 1. |
| Facilities | Used to filter data based on user facilities (common facility name) specified while mapping Vocera Voice Server User Site and Engage Facility. |
The dashboard consists of the following sections:
- Usage Comparison
- Integration Summary
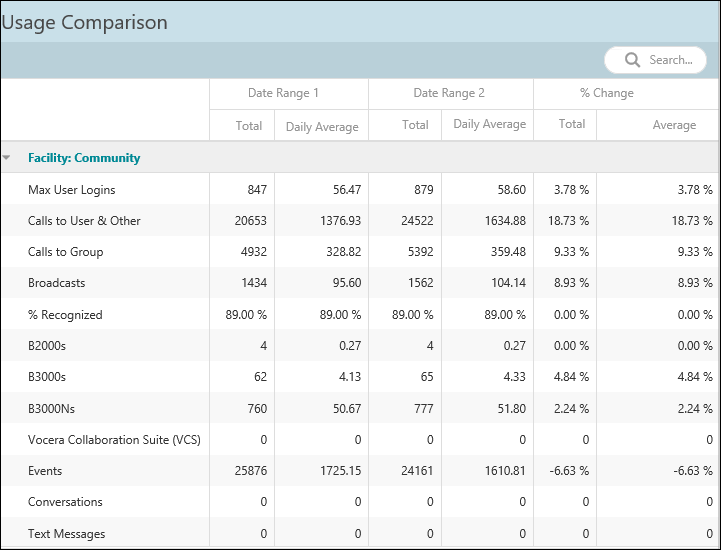
Usage Comparison
Following is a sample Usage Comparison dashboard:
The following table describes the calculations used for the data points.
| Field | Description |
|---|---|
| Date Range |
Note: The calculation is the same for Date Range 1 and Date Range 2.
|
| % Change |
|
The following table describes the fields and its description.
| Field | Description |
|---|---|
| Max User Logins | Specifies the total and daily average count for maximum user logins for the selected date range. |
| Call to User & Other | Specifies the calls to user and others. Others include Telephone, Address Book and Buddy. |
| Call to Group | Specifies the calls to type Group. Displays the number of times the users within this facility were interrupted by group interruptions. |
| Broadcasts |
Specifies the number of times the user was interrupted by broadcast done to the group within this facility. |
| % Recognized | Specifies the percentage of speech recognized. The calculation used is (recognized /
(recognized+rejected+others)) x 100. Note: The genie session recognition percentage is
grouped based on initiator user facility.
|
| B2000, B3000, B3000N | Specifies the number of badges used in the facility for the selected date range. For example, four badges are used in the Community facility for the selected date range. It can be any activity performed by these badges. |
| Vocera Collaboration Suite (VCS) | Specifies the number of VCS mobile app users in the facility for the selected date range. |
| Events | Specifies the event count based on the sum of Engage and VMI data. |
| Conversations | Specifies the number of conversations that had new text messages based on receiver user facility for the selected date range. For example, if there are ten messages for one conversation, the count for conversations are displayed as 1 and count for messages will be displayed as 10. |
| Text Messages | Specifies the number of text messages that were initiated by the receiver user for the selected date range. |
To find a specific facility or field, use the Search field.
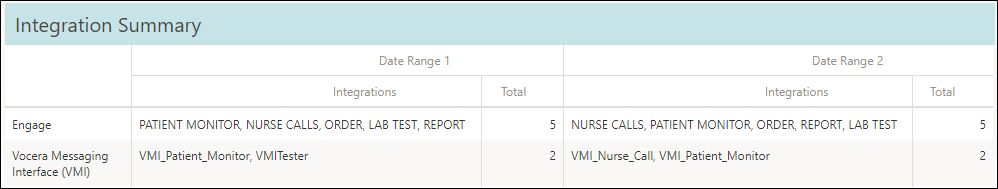
Integration Summary
The Integration Summary dashboard displays the integration source or client details and a total number of integrations from Engage and VMI during the selected date range.
Following is a sample Integration Summary dashboard: