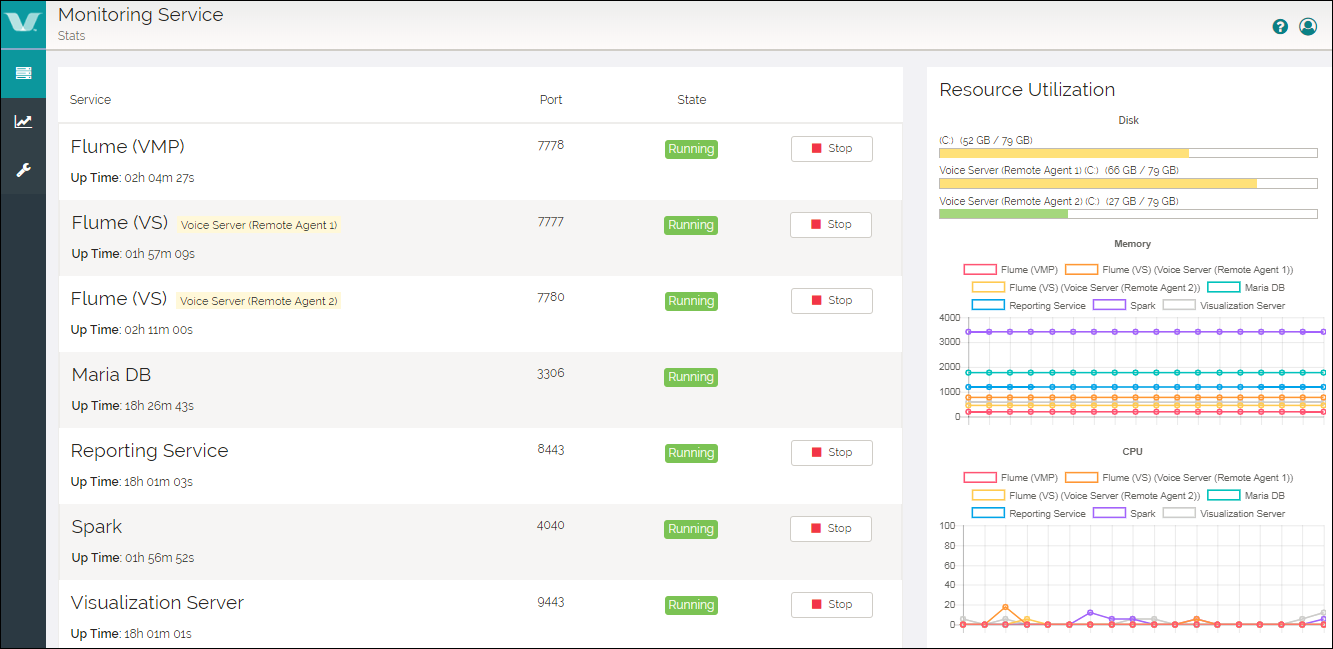
Statistics dashboard lists all configured services that run in the Vocera Analytics Server or remote Voice Servers. It also displays the utilization of the resources such as disk, memory, and CPU.
It consists of two parts:
- Services
- Resource Utilization
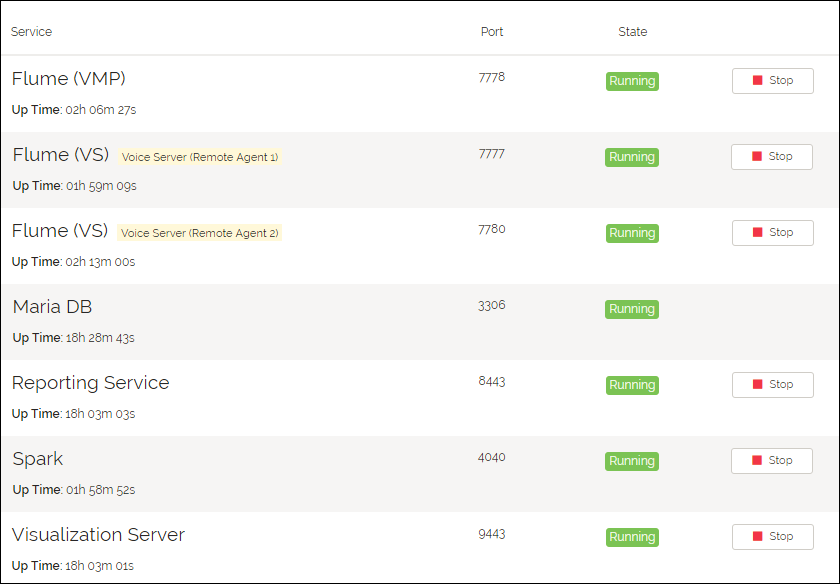
Services
The services used in Vocera Analytics are:
- Flume (VMP)—Flume agent that ingests data from the VMP database server into the Spark processing engine.
- Flume (VS)—Flume agent that runs on the Voice Server node to ingest data from the Voice Server logs.
- Flume (Engage)—Flume agent that ingests data from the Engage Landing (LDG) database.
- MariaDB—Database to store database records and control metadata.
- Reporting Service—Tomcat server to serve Crystal reports on web.
- Spark—Processing Engine to read data from sources (VMP, Voice Server, and Engage) through Flume agents, transform into database records, and load them into the database.
- Visualization Server—Web server that serves dashboards and provides a REST API for fetching visualization data.
Note: Vocera recommends that you start all Flume services before starting
Spark.
Note: If the Vocera Analytics Server is restarted, all services such as Flume,
Spark, Reporting Service, and Visualization Server will be in Stop
state. Ensure that you start all services.
The table below lists the fields that each service displays.
| Field | Description |
|---|---|
| Up Time | Indicates the duration of the service from the time it was last started. The duration is provided in hours and uses the days, hours, minutes, seconds format. |
| Port | Indicates the port number used by the service. Every service has a default port number. However, the user can change the default port number manually during configuration only for Flumes, Reporting services, and Visualization services. |
| State | Indicates the status of the service that is, if a service is running or stopped. |
| Start/Stop | Indicates a toggle switch to start/stop a service. |
Note: MariaDB service cannot be started/stopped from Monitoring Service. It can only
be done from Windows Service.
Resource Utilization
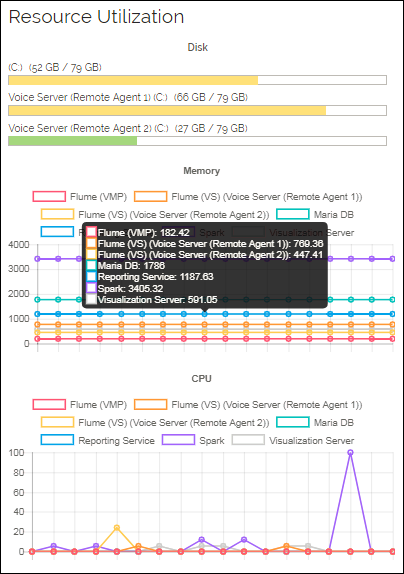
Resource Utilization section is categorized into three segments:
- Disk—Displays the disk name and the amount of space utilized versus the total space
available on the disk. The disk space is color coded and displays green if utilization is
less than 60%, orange if utilization is between 61-80%, and red if utilization is more
than 80%.Note: The server name of the disk is displayed only if a service is configured on a different system from the Analytics server.
- Memory—Displays the memory usage for the last three minutes. The values are provided in MB.
- CPU—Displays the CPU usage for the last three minutes. The values are provided as percentages.
To display the utilization details of each service for the selected time frame, hover the mouse over Memory utilization graph or CPU utilization graph.
Note: If there is an
error connecting to a remote agent, the services associated with this remote agent will not
appear. To notify the user, the system displays the following error: Could not
connect to machine <remote agent name>