[Data Source: Engage] Lists all alarms and alerts that are sent, accepted, escalated, and not responded for all beds in a unit with their respective timestamp. It also includes the total time taken to process the alarm or alert.
The information displayed on the screen is determined based on the filters that you apply. The available filters are:
| Filter Name | Filter Description |
|---|---|
| Date Range | The date range to include in the results. By default, the value is the current date; however, you can select from a list of options. For example, you can select the option "Last 7 days" or "Last 30 days." |
| Sources | Used to filter Engage alarms and
alerts data. For example Nurse Call, Patient Monitor, Report, and so
on. Note: This list is automatically updated when new integrations
are added through the Vocera Engage Appliance.
|
| Tiers | Used to filter Vocera Engage alerts and alarms data based on using Escalation Tier information. For example, Tiers can be Primary, Secondary, or Tertiary. |
| Facilities | Used to filter data based on user facilities (common facility name) specified while mapping Vocera Voice Server User Site and Engage Facility. |
| Units | Used to filter data based on user
units (common unit name). Common unit names are referenced from a
crosswalk table cwunit that are mapped from Vocera Voice Server User Department and Engage Units. Note:
The displayed units drop-down filter may be constrained due to the Facilities filter. Unknown Unit or Department display data for all users that are not part of any department selected within the Facilities filter. |
| Beds | Used to filter alarms and alerts data based on Engage Room-Bed names. |
| Descriptions | Used to filter Engage alarms and alerts data based on its description. |
| Priorities | Used to filter interruptions data based on its priority. Displays high, urgent, normal priority for VMP messages, VMI, and Vocera Voice Server. It also displays alarms and alert priorities from Engage. |
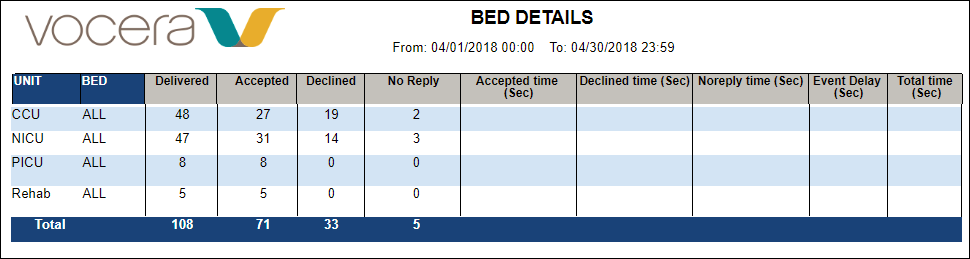
The following figure displays a Bed Detail report. Click on a unit name to drill down to view the list of beds within the unit. To view the details of a particular bed, click on a bed to view the details of the bed.
Delivery to groups will never have the correct response; that is, no response will be linked with an Engage appliance?
- Group A delivery consists of user 1 and user 2.
- User 1 and User 2 respond.
- Metric Calculation: 1 alarm event, 2 deliveries, 2 responses. Since user does not match delivery group, the user reply metrics will be calculated and displayed as 0.
Bed Detail Data Dictionary
The following table lists the report parameters and its description.
| Column | Data Type | Description |
|---|---|---|
| Delivered | numerically-based | Count of the events that were delivered to recipients, such as a clinician's smartphone. |
| Accepted | numerically-based | Count of the events that were delivered and accepted by recipients. |
| Declined | numerically-based | Count of the events that were delivered and declined by recipients. |
| No Reply | numerically-based | Count of the events that were delivered, but neither accepted nor declined by the recipient. No Reply indicates an event that is automatically escalated to the next tier. |
| Accepted Time (Sec) | numerically-based | Total time for a recipient to accept the event notification. |
| Declined Time (Sec) | numerically-based | Total time for a recipient to decline the event notification. |
| No Reply Time (Sec) | numerically-based | Total time time elapsed when a recipient does not reply to an event (usually prior to an escalation rule). |
| Event Delay (Sec) | numerically-based | Amount of time an event may be intentionally delayed by a rule configuration. |
| Total Time (Sec) | numerically-based | Total time between event creation and first accept/decline. |