[Data Source: Voice Server, Engage, VCS, VMI] Provides an interruption summary for specific users. Data includes interruption types, user ID, name, facility, unit, group, time of occurrence, as well as a time trend. Use this dashboard to review interruptions for specific users and units as well as for reviewing specific times where users may be overwhelmed.
The information displayed on the screen is determined based on the filters that you apply. The available filters are:
| Filter Name | Filter Description |
|---|---|
| Date Range | The date range to include in the results. By default, the value is the current date; however, you can select from a list of options. For example, you can select the option "Last 7 days" or "Last 30 days." |
| Facilities | Used to filter data based on user facilities (common facility name) specified while mapping Vocera Voice Server User Site and Engage Facility. |
| Units | Used to filter data based on user
units (common unit name). Common unit names are referenced from a
crosswalk table cwunit that are mapped from Vocera Voice Server User Department and Engage Units. Note:
The displayed units drop-down filter may be constrained due to the Facilities filter. Unknown Unit or Department display data for all users that are not part of any department selected within the Facilities filter. |
| Interruption Types | Used to filter interruptions data based on the interruption type. Displays calls, messages, alarms, and alerts. |
| Priorities | Used to filter interruptions data based on its priority. Displays high, urgent, normal priority for VMP messages, VMI, and Vocera Voice Server. It also displays alarms and alert priorities from Engage. |
| Source Types | Used to filter interrupts
data based on the source type. The source types are:
Note: Source
Type filter is used in Interrupt Type.
|
The User Interruptions dashboard provides detailed information on interrupts encountered by the hospital staff within a hospital system. You can view the details of an interrupt encountered by a particular user.
The interrupts are further classified based on interrupt types such as alarms, alerts, calls, and messages.
The User Interruptions dashboard has the following widgets:
- Totals
- Trend
- Details
Delivery to groups will never have the correct response; that is, no response will be linked with an Engage appliance?
- Group A delivery consists of user 1 and user 2.
- User 1 and User 2 respond.
- Metric Calculation: 1 alarm event, 2 deliveries, 2 responses. Since user does not match delivery group, the user reply metrics will be calculated and displayed as 0.
The User Interruptions dashboard includes contextual filters.
The contextual filters contain a source and a target widget. In this case, Totals is the source widget and Trend and Details are target widgets. Click a user in Totals widget to display only the corresponding user data in the remaining widgets. For example, click user Dominic, John to display only the details of Dominic, John in Trend and Details widgets.
Totals
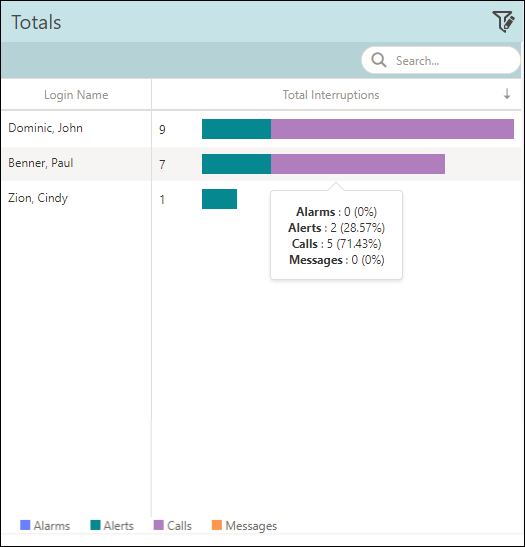
The Totals widget displays the total number of interruptions encountered by a target user. Data is sorted based on total interruptions. The Login Name column represents the name of the user. The Total Interruptions column displays the total interruptions count and a bar graph that depicts the types of interruptions encountered by the user. Mouse over a bar graph to display the individual interruption count and its corresponding percentage.
- Total Interruptions—7
- Alarms—0
- Alerts—2
Percentage of Alerts is (2/7)x100=28.57%
- Calls—5
Percentage of Calls is (5/7)x100=71.43%
- Messages—0
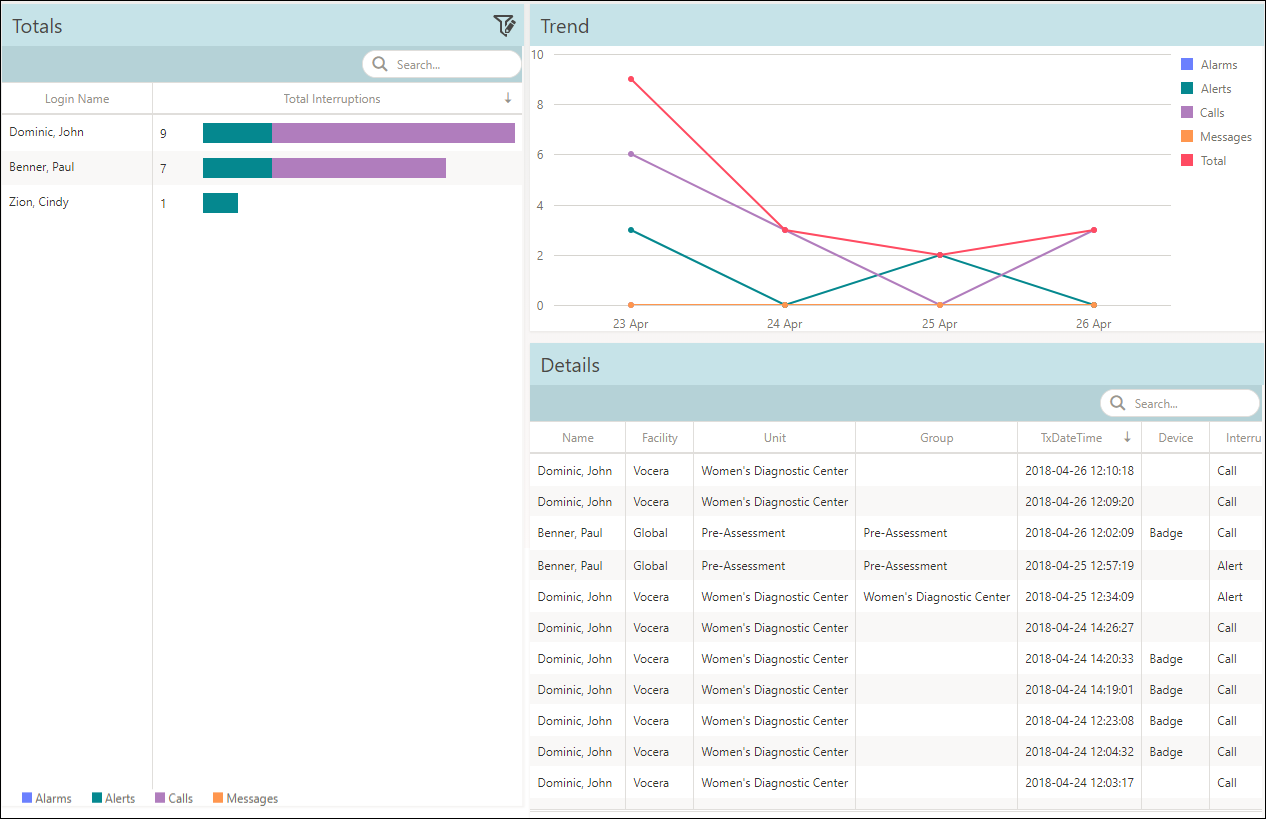
Trend
The Trend widget represents the total interruptions encountered for the selected timeline in a trended graph. The timeline is adaptive based on the date range. For example, if the date range selected is 1 day, the timeline displays data for every hour. If the date range is more than a day and less than a month, the timeline displays data for every day.
Mouse over a timeline or a particular trend graph to display the individual count for each interruptions type and the total interruptions count.
For example, in the following figure, the count for 23 Apr displays Alarms: 0, Alerts: 3, Calls: 6, Messages: 0, and Total: 9.

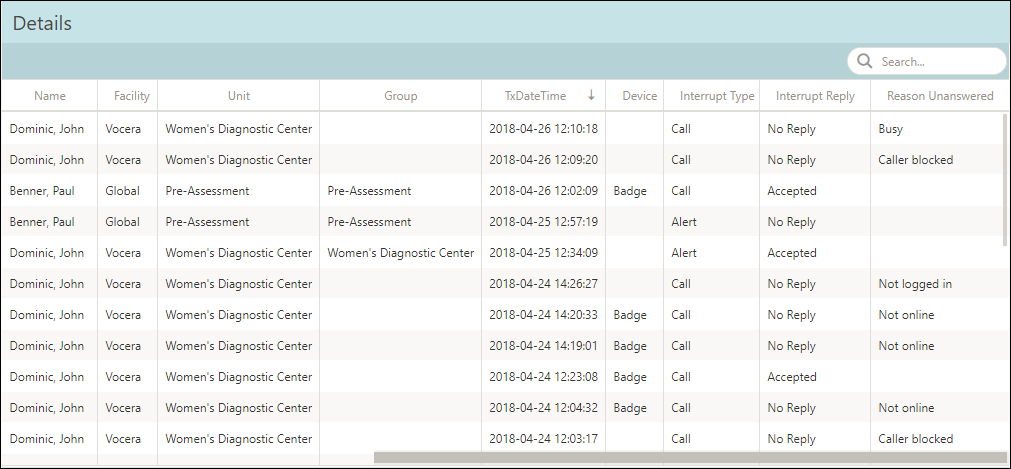
Details
The Details widget summarizes the details of every interrupt that a user encountered during the selected date range. Details such as facility, unit, and group that a user belongs is displayed. The widget also displays the timestamp of the interruption, device that interrupted the user, response by the user for the encountered interrupt, and unanswered reason if the interrupt was unanswered. To find a particular value in the displayed fields, use the Search field.